The Honest Empty
For seven economies, our own engine considered more than four hundred products each and returned nothing. We ship that result rather than fill the space, because the emptiness is the diagnosis.
Ten articles of this series have pressed institutions on whether they know what their instruments achieved, and on whether they report the null result when they get one. This piece applies the same test to us. On every market profile we publish, a module answers the question of what an economy is positioned to build next. For seven of the 117 markets we score, it answers nothing, and this is an account of why we let it.
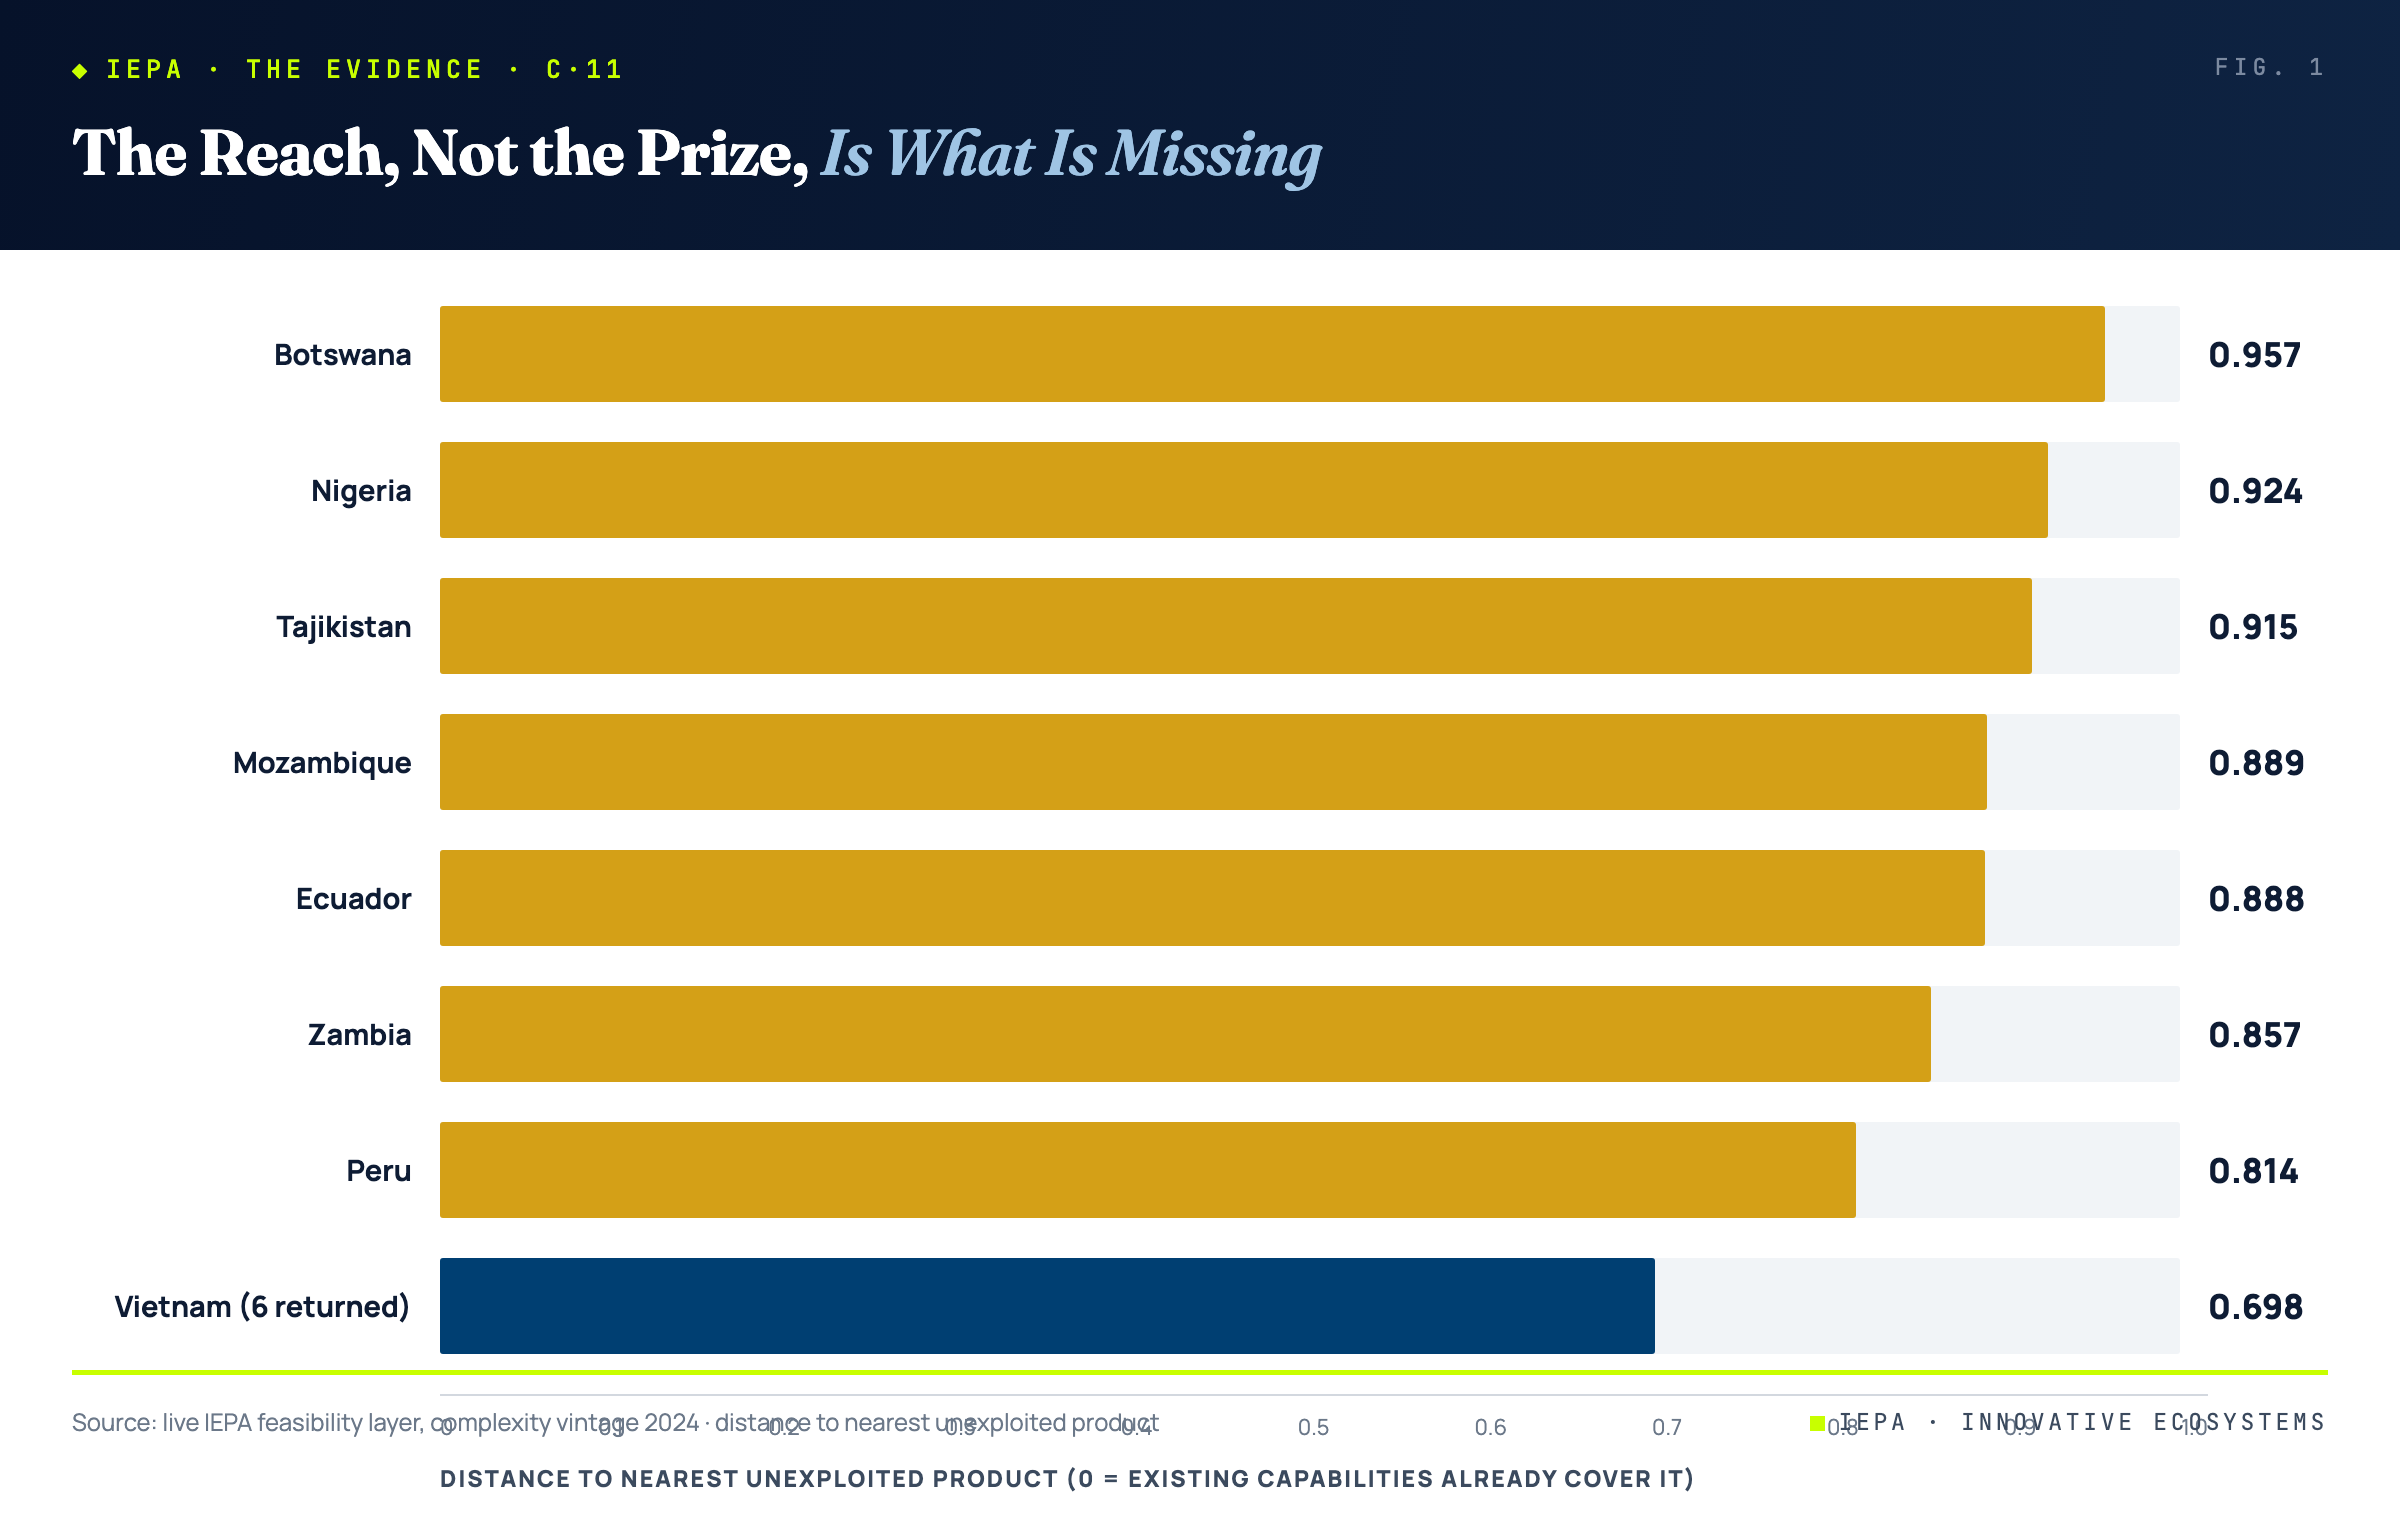
- Seven markets return an empty result. Peru, Zambia, Tajikistan, Ecuador, Mozambique, Botswana and Nigeria. In each case the engine assessed between 428 and 468 candidate products and none cleared the bar.
- It is not that the opportunities are unattractive. Botswana has a candidate product whose opportunity gain is 0.579, more than ten times our threshold. It is simply not among the products Botswana is close to reaching.
- Distance is the binding constraint. Botswana's nearest unexploited product sits at 0.957 on a scale where zero is adjacent. Vietnam's sits at 0.698, and Vietnam gets six recommendations.
- Taiwan is missing for three different reasons at once. It ranks second in the world on economic complexity, holds no rows in the product-level trade data this module reads, and is not scored in our index at all. An absence of evidence and an evidenced absence look identical on a page, and we label them differently.
There is a strong temptation in any analytical product to always return something. A blank panel reads as a broken feature, a user who wanted an answer leaves without one, and the fix is usually a single relaxed threshold away. Loosen the filter, return the six least-bad options, and the interface looks complete. We decided not to do that, and the decision is worth explaining because it is the same standard this series has been applying to everyone else.
01What the Module Is Asked to Do
On each market profile, the feasibility layer answers a specific question: given what this economy already exports competitively, which products is it both close enough to reach and worth reaching? The logic is not a black box, so it is worth stating in full.
A candidate is any product the economy does not currently export with comparative advantage, drawn from a curated set that excludes raw natural resources and requires a world market of at least five billion dollars, so that the recommendation is not a niche. Each candidate carries two numbers. Distance measures how far the product sits from the economy's existing capabilities, where a low value means the capabilities largely overlap. Opportunity gain, which the underlying research calls complexity outlook gain, measures how much reaching that product would open up further products beyond it.
The engine then applies two conditions at once. The product must sit in the nearest ten percent of that economy's own candidate set, and its opportunity gain must exceed 0.05. Both must hold. A product that is easy to reach but leads nowhere fails, and so does a product that would transform the economy but sits on the far side of the capability space.
Reachable but leading nowhere fails. Transformative but unreachable fails. The recommendation has to be both, and for seven economies nothing is.
02The Seven
| Market | Products assessed | Nearest candidate | Complexity rank |
|---|---|---|---|
| Peru | 428 | 0.814 | 102 of 145 |
| Zambia | 443 | 0.857 | 104 of 145 |
| Tajikistan | 449 | 0.915 | 129 of 145 |
| Ecuador | 450 | 0.888 | 110 of 145 |
| Mozambique | 459 | 0.889 | 128 of 145 |
| Botswana | 467 | 0.957 | 93 of 145 |
| Nigeria | 468 | 0.924 | 140 of 145 |
| Vietnam, for contrast | 369 | 0.698 | 44 of 145 |
The first column is the one that matters for the honesty of the result. These are not thin cases where the engine had little to work with. Nigeria's profile was assessed against 468 candidate products. Botswana's against 467. The engine looked at more options for these economies than for Vietnam, which receives six recommendations, and still concluded that none of them qualified.
03Why Nothing Qualifies
The obvious explanation would be that these economies have no attractive opportunities available. That explanation is wrong, and the data says so plainly. Among the products Botswana was assessed against, the highest opportunity gain is 0.579, more than ten times the threshold the engine requires. There is something enormously valuable Botswana could build.
It is simply not near. Botswana's nearest unexploited product sits at 0.957 on a scale where zero would mean its existing capabilities already cover the requirements. The high-value opportunities are further still. The two conditions never meet in the same product: everything close enough to reach opens nothing, and everything worth opening is out of reach.
That pattern has a common cause. Each of these economies exports a narrow set of things, and a narrow export base produces a narrow capability base. The skills, institutions, supplier networks and logistics developed for copper or oil or fishmeal overlap with very few other products, which places the entire rest of the product space at a distance. This is the structural condition the complexity literature describes, and the low complexity ranks in the table are the same fact measured a different way.
So the empty panel is not a failure to find an answer. It is an answer, and a fairly precise one: for this economy, adjacent diversification is not currently available, and a strategy built on moving one step sideways into a nearby product will not work because there is no nearby product. That is a materially different situation from Vietnam's, and it calls for a different response, which is precisely why it should not be disguised with six weak suggestions.
04Taiwan Is Three Different Gaps
The clearest case for labelling gaps precisely is one that never reaches a profile page at all. Taiwan ranks second of 145 economies on the complexity measure this module is built around, ahead of every economy in the table above and most of the index. It also holds zero rows in the product-level trade data the feasibility layer reads, so the engine cannot assess a single candidate for it. And it carries raw indicator values in our own store without ever being scored, so it has no market profile for a blank panel to appear on.
Those are three distinct statements and only the first is about Taiwan. Ranking second is a finding. Holding no product-level rows is a fact about a dataset. Not being scored is a fact about our coverage. Collapse them into one blank panel and a reader could reasonably conclude that one of the most sophisticated economies on earth has no diversification prospects, which would be the exact inversion of what the evidence says. The seven markets above look superficially similar and mean the opposite: there we looked hard and found nothing.
This is worth stating as a general principle, because it recurs everywhere in this series. The eighty-four percent of investment promotion agencies that failed to reach half marks is an evidenced absence. The lack of any subsequent benchmarking exercise is an absence of evidence. Both are findings. They are not the same finding, and a publication that cannot tell its reader which one it is holding should not be trusted with either.
05Why We Ship It
The commercial argument for filling the space is real. An empty module looks unfinished, and a competitor who returns six suggestions for every market appears more capable. Relaxing the near-decile condition, or dropping the opportunity-gain floor to zero, would populate all 117 markets tomorrow and no user would notice the change.
They would, however, act on it. A recommendation to a Nigerian ministry that it should target a product 0.92 of the way across the capability space is not a neutral piece of interface furniture. It is advice, it would be followed by somebody, and it would waste public money on a diversification strategy the underlying research says is unlikely to work from that starting position. The cost of the false positive lands on the reader, and the benefit of appearing complete lands on us. That asymmetry is the whole argument.
There is also a narrower reason, which is that an index which never returns nothing is not measuring anything. If every economy receives six recommendations regardless of its position, the recommendations are not derived from the position and the module is decorative. The empty result is the evidence that the filter is real. It is the same logic as a medical test that always comes back positive, which is not a reassuring test but a broken one.
06The Builder's Reading
- If your dashboard never returns nothing, check whether the filter is doing anything. A panel that always populates is either measuring something universal or measuring nothing.
- Distinguish the two blanks in the interface, not in a footnote. We looked and found nothing, and we cannot see, require different words on the page.
- For a concentrated economy, adjacency is the wrong strategy. When the nearest product sits at 0.9 and above, incremental diversification has no foothold. The options are longer-horizon capability building or deliberate leaps, and both need different instruments.
- Publish the null result before someone finds it. The seven markets in this article were always going to be visible to anyone comparing profiles. Explaining them is stronger than being asked about them.
- Write the thresholds down. Ours are a near-decile condition and an opportunity gain above 0.05. A filter nobody can inspect is indistinguishable from an arbitrary one.
The wider point returns to where this series began. We have spent ten articles noting that agencies report the counts they can produce rather than the effects they cannot, and that the instruments which survive are the ones that always have something to announce. A module that always returns six recommendations is the same instinct in software. The discipline is not that the empty result is comfortable, because it is not. It is that a system honest enough to say nothing is a system whose other answers mean something.
Figures are computed by the live IEPA feasibility layer against the current complexity vintage, and will change with each annual data refresh. Candidates exclude raw natural resources and require a world export market of at least five billion dollars. Distance and complexity outlook gain follow the definitions used in the underlying economic complexity research. Complexity ranks are drawn from the same vintage and cover 145 ranked economies. Taiwan is not scored in the index and therefore has no market profile: it carries raw indicator values but no computed zone scores, and holds no rows in the product-level trade data the feasibility layer reads. It is ranked second of 145 on the complexity measure itself. These are coverage facts and a ranking, not a finding about its diversification prospects.
- Innovative EcoSystems. The IEPA feasibility layer, live engine output. 2026.
- Hidalgo, C. A. and Hausmann, R. (2009). The Building Blocks of Economic Complexity. Proceedings of the National Academy of Sciences, 106(26), 10570–10575.
- Hausmann, R., Hidalgo, C. A., et al. The Atlas of Economic Complexity: Mapping Paths to Prosperity. Harvard Growth Lab.
- Innovative EcoSystems. Who Promotes the Promoters. 2026.
- Innovative EcoSystems. What Actually Worked. 2026.
A Gap Is Not a Verdict
Sixteen economies build far more capability than they convert into investment. Their prosperity outcomes run from 38.6 to 71.2. The gap alone tells you nothing.
→Explore the IEPA
Six zones, every market this research is scored from.
→Open the Atlas
The live global registry this research is drawn from.
→