A Gap Is Not a Verdict
Fourteen economies build far more capability than they convert into inward investment. Their prosperity outcomes run from 38.6 to 70.0. The gap on its own is a question, not a diagnosis.
This series closes on a metric of our own that is easy to misread, and on the discipline required to publish it anyway. Comparing an economy's four foundation zones against its FDI Accelerator produces a gap, and a large gap looks like a failure to convert capability into investment. For some economies it is. For others it is a description of a country that never needed the capital. Telling them apart requires a third number, and any reading that skips it will be confidently wrong.
- Fourteen economies show a gap above 30 points. Japan is the widest at 58.9, with foundations at 77.3 against an FDI Accelerator of 18.4.
- The same gap sits on completely different economies. Among those fourteen, prosperity outcomes range from 38.6 in Bolivia to 70.0 in the United States. Switzerland carries a 33.6 gap and the second-highest prosperity in the group.
- So the gap is not a deficiency by itself. An economy converting capability into prosperity through domestic channels does not need the accelerator, which is the finding this publication reached earlier by another route.
- It becomes a diagnosis only in combination. High capability, low conversion, and weak outcomes together describe an economy where something is genuinely blocked. Any two of the three do not.
An index invites arithmetic, and some of the arithmetic is misleading. Subtract an economy's FDI Accelerator from the average of its four foundation zones and you get a number that seems to mean something obvious: how much capability this place has built without attracting the capital to match. Presented as a league table it would be a striking piece of content. It would also lead a reader to conclusions the underlying data does not support, and the reason is worth setting out in full, because the same trap sits inside most composite indices.
01The Gap, Measured
The four foundation zones cover innovation capacity, entrepreneurship capacity, resilience and alignment. The FDI Accelerator measures how much foreign investment an economy attracts and retains relative to its size, and is weighted in the composite as an engine rather than a foundation, on the thesis that capital multiplies what an economy has built rather than originating it.
The index scores 117 markets, and 115 of them carry a complete set of four foundation zones, which is what the gap requires. Across those 115, fourteen show a gap of more than 30 points between their foundation average and their accelerator. The widest belongs to Japan, whose foundations average 77.3 against an FDI Accelerator of 18.4, a spread of 58.9 points. New Zealand, the United Kingdom, China and Australia all exceed 50.
Stated that way it sounds like a diagnosis, and the temptation is to reach immediately for an explanation: barriers to entry, language, regulatory complexity, a domestic preference for domestic ownership. Some of those may be true. None of them follows from the gap.
02The Same Gap, Different Economies
Add prosperity outcomes to the same fourteen and the apparent pattern dissolves.
| Economy | Foundations | FDI Accelerator | Gap | Prosperity |
|---|---|---|---|---|
| Japan | 77.3 | 18.4 | 58.9 | 59.0 |
| New Zealand | 79.0 | 23.9 | 55.1 | 65.6 |
| United Kingdom | 81.4 | 29.2 | 52.1 | 61.3 |
| China | 60.4 | 8.7 | 51.7 | 68.8 |
| Australia | 80.7 | 30.4 | 50.3 | 69.2 |
| Uruguay | 61.5 | 17.7 | 43.8 | 57.9 |
| Argentina | 48.1 | 8.0 | 40.2 | 51.0 |
| United States | 75.4 | 39.1 | 36.4 | 70.0 |
| Switzerland | 84.2 | 50.6 | 33.6 | 69.5 |
| Bolivia | 46.5 | 16.1 | 30.4 | 38.6 |
| Canada | 78.8 | 48.5 | 30.2 | 63.2 |
Switzerland and Bolivia both appear here. Switzerland carries a 33.6 point gap and a prosperity score of 69.5. Bolivia carries a 30.4 point gap and a prosperity score of 38.6. On the metric that supposedly identifies a conversion failure, they are neighbours. On every question anyone actually cares about, they are not.
Switzerland and Bolivia sit within three points of each other on the gap. Thirty-one points apart on prosperity. The gap did not tell you which was which.
03Why the Gap Can Be Benign
The explanation is contained in what the accelerator zone is for. This publication has previously shown that foreign investment behaves as a multiplier on existing foundations rather than an originator of capability. An economy with strong foundations and deep domestic capital markets can finance its own firms, and simply does not require much inward investment to convert capability into output. Switzerland is the clearest case in the table: a 33.6 point gap sitting underneath the second-highest prosperity score in the group.
For those economies, a low accelerator score is a fact about their financing structure rather than a failure of attraction. Reading it as underperformance would suggest a policy response, attracting more foreign capital, that addresses nothing. Switzerland does not have an investment promotion problem.
China is worth noting separately because its gap arises differently again. Its foundations sit at 60.4 and its accelerator at 8.7, the lowest in the group, on an economy with prosperity outcomes of 68.8. An accelerator measured relative to economic size will register low for very large economies regardless of absolute inflows, and capital account management does the rest. The gap is real, its causes are structural, and it does not describe a country failing to convert.
04When It Is a Diagnosis
The gap becomes informative when it appears alongside outcomes that are not keeping up. An economy with capability in the seventies, an accelerator in the teens or twenties, and prosperity outcomes below its foundation level is describing something specific: it has built the inputs, it is not attracting external capital, and it is not converting through domestic channels either. That combination points at a blockage between capability and output which neither an investment strategy nor a capability programme alone will resolve.
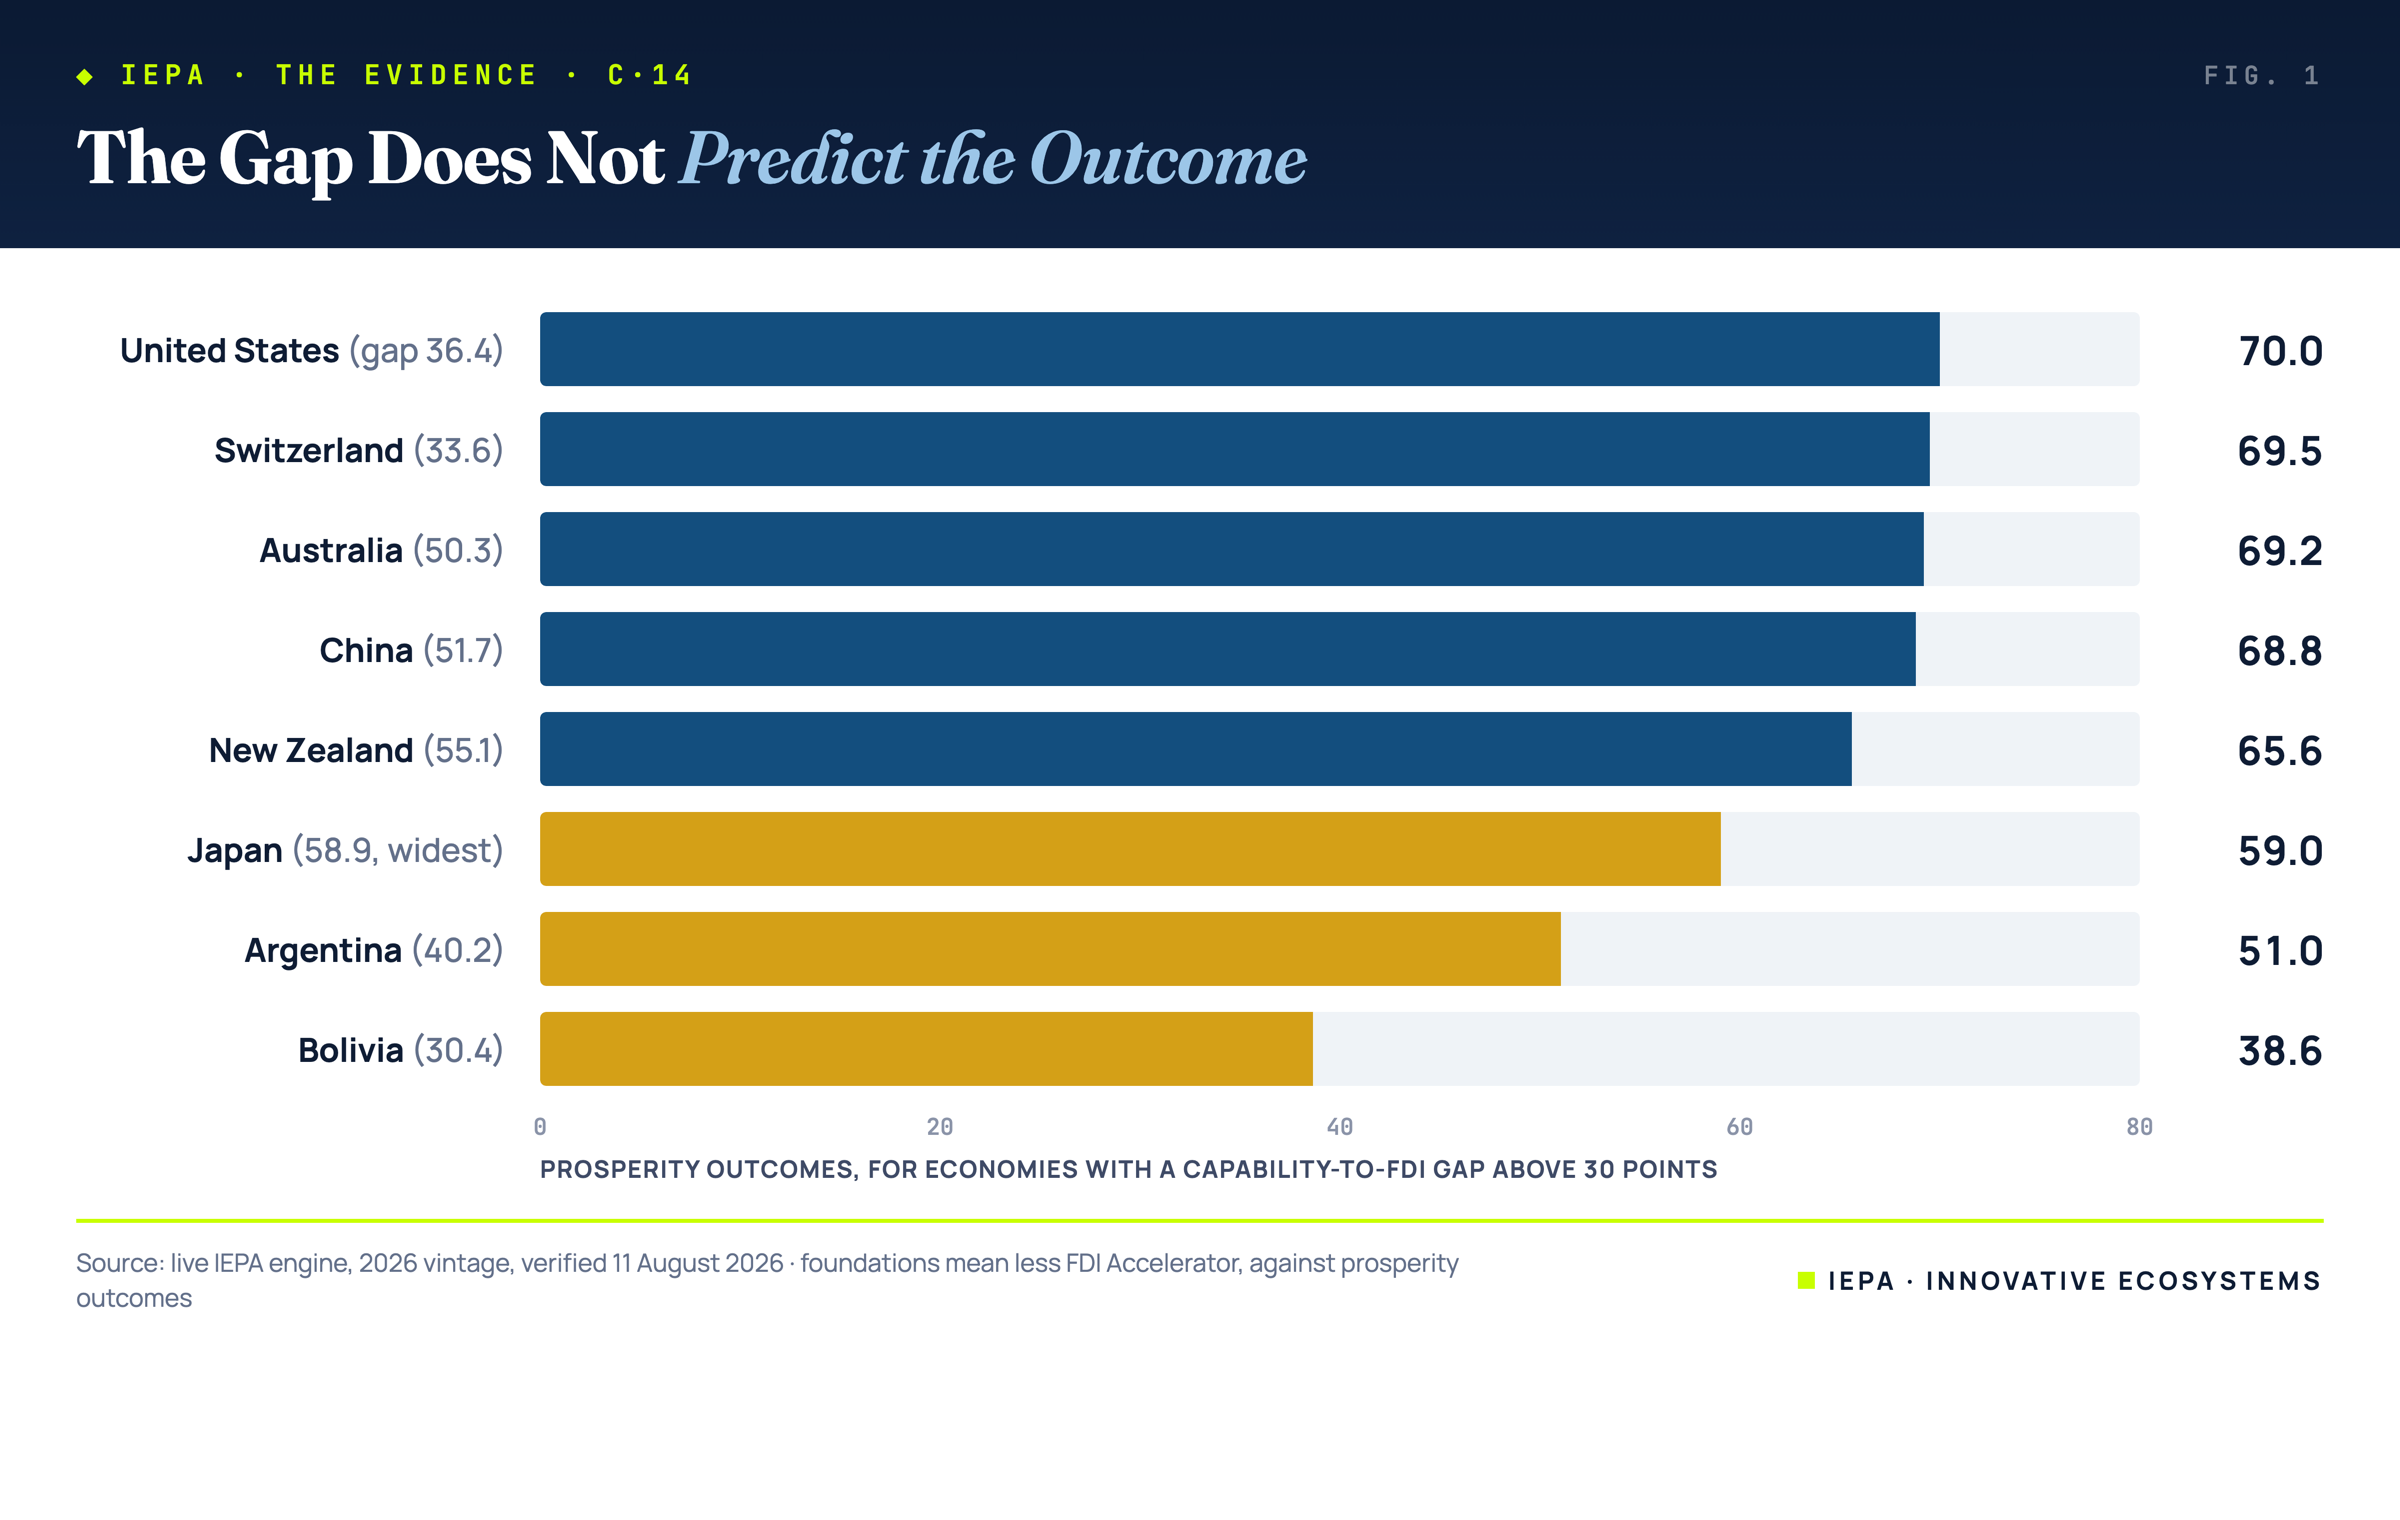
Two economies in the table sit closest to that description, and neither is the one with the widest gap. Argentina shows foundations of 48.1 against an accelerator of 8.0 and prosperity of 51.0. Bolivia shows 46.5 against 16.1 with prosperity of 38.6. In both, capability is modest, external capital is scarce, and outcomes trail. That is a different situation from Japan's, and it calls for different instruments, which is precisely the distinction the gap alone erases.
05Why We Are Publishing a Metric We Are Warning About
The straightforward option would be to not compute this at all. A number that invites a wrong reading is a liability, and no user has asked for it. We are publishing it because the alternative is worse: the four foundation zones and the accelerator are all on the market profiles already, the subtraction takes ten seconds, and somebody will do it. A ranking of conversion failures assembled from our own published components, without the third variable, is a plausible piece of analysis that we would have made possible and not addressed.
There is also a principle underneath it that this series has been applying to everyone else. An index that only shows the readings which flatter its own interpretation is doing the same thing as a program that only reports the metrics it can produce. If a derived measure from our own data can mislead, the useful response is to derive it first and explain the trap, rather than leave it as an exercise for a reader who has no reason to know about the third variable.
06The Builder's Reading
- Never read a gap without the outcome. Capability minus attraction is meaningless until you know what the economy is achieving anyway. Switzerland and Bolivia prove the point.
- Ask what is financing your firms. A low accelerator on deep domestic capital markets is a structural fact, not a deficiency, and no promotion strategy improves it.
- Check whether size is producing the reading. Accelerator scores are relative to economic size, so very large economies will read low regardless of absolute inflows.
- The diagnostic case is all three together. Capability built, capital not arriving, and outcomes trailing. Any two of those describe something else entirely.
- Derive the dangerous ratios yourself. If your published components permit a misleading subtraction, someone will perform it. Doing it first and explaining it is the only version you control.
That is where this series ends, and it is the same place it began. Thirteen articles have examined instruments that were measured by what they could count rather than what they changed: investments that would have arrived anyway, zones counted by occupancy, incubators counted by existence, agencies counted by beneficiaries. The last one is ours. A gap computed from our own index would count something real, would rank economies convincingly, and would be wrong about most of them. The discipline is not that we avoid producing such numbers. It is that we say so.
Foundations is the unweighted mean of the innovation capacity, entrepreneurship capacity, resilience and alignment zones. The gap is that mean less the FDI Accelerator score. All figures are live IEPA engine outputs for the 2026 assessment year and will move with each refresh. The index scores 117 markets; the gap is computable for the 115 holding all four foundation zones. The two excluded, Myanmar and Turkmenistan, lack an entrepreneurship capacity score, and both sit well below the 30 point threshold on the zones they do hold. Fourteen economies show a gap above 30 points; eleven are shown in the table, selected to span the prosperity range. Figures were re-verified against the engine on 11 August 2026; membership of the group moves as the engine refreshes. Prosperity outcomes is a scored zone within the same index, not an external measure, so the comparison is internal to the engine and is presented as such.
- Innovative EcoSystems. The Accelerator, Not the Engine. 2026.
- Innovative EcoSystems. Why We Built Six Zones Instead of One Number. 2026.
- Innovative EcoSystems. The Honest Empty. 2026.
- Innovative EcoSystems. The Threshold Nobody Budgets For. 2026.
- Borensztein, E., De Gregorio, J. and Lee, J-W. (1998). How Does Foreign Direct Investment Affect Economic Growth? Journal of International Economics, 45(1), 115–135.
State of the Index 2026
The annual read: where capability rose, where alignment slipped, and the year's biggest movers.
→Explore the IEPA
Six zones, every market this research is scored from.
→Open the Atlas
The live global registry this research is drawn from.
→