Seventy Percent Would Have Come Anyway
The method for detecting whether an incentive changed anything was devised in 1985. It was applied and published by 2009. In 2024 a national review found the analysis had still never been done. The problem is not that we do not know.
Tax incentives are the first instrument most agencies reach for and the last one anyone audits. They are fast to announce, cheap to legislate, and their cost never appears as a line in a budget. The question of whether they change investor behavior has an answer, and it has had one for some time: for most investors, in most places, they do not.
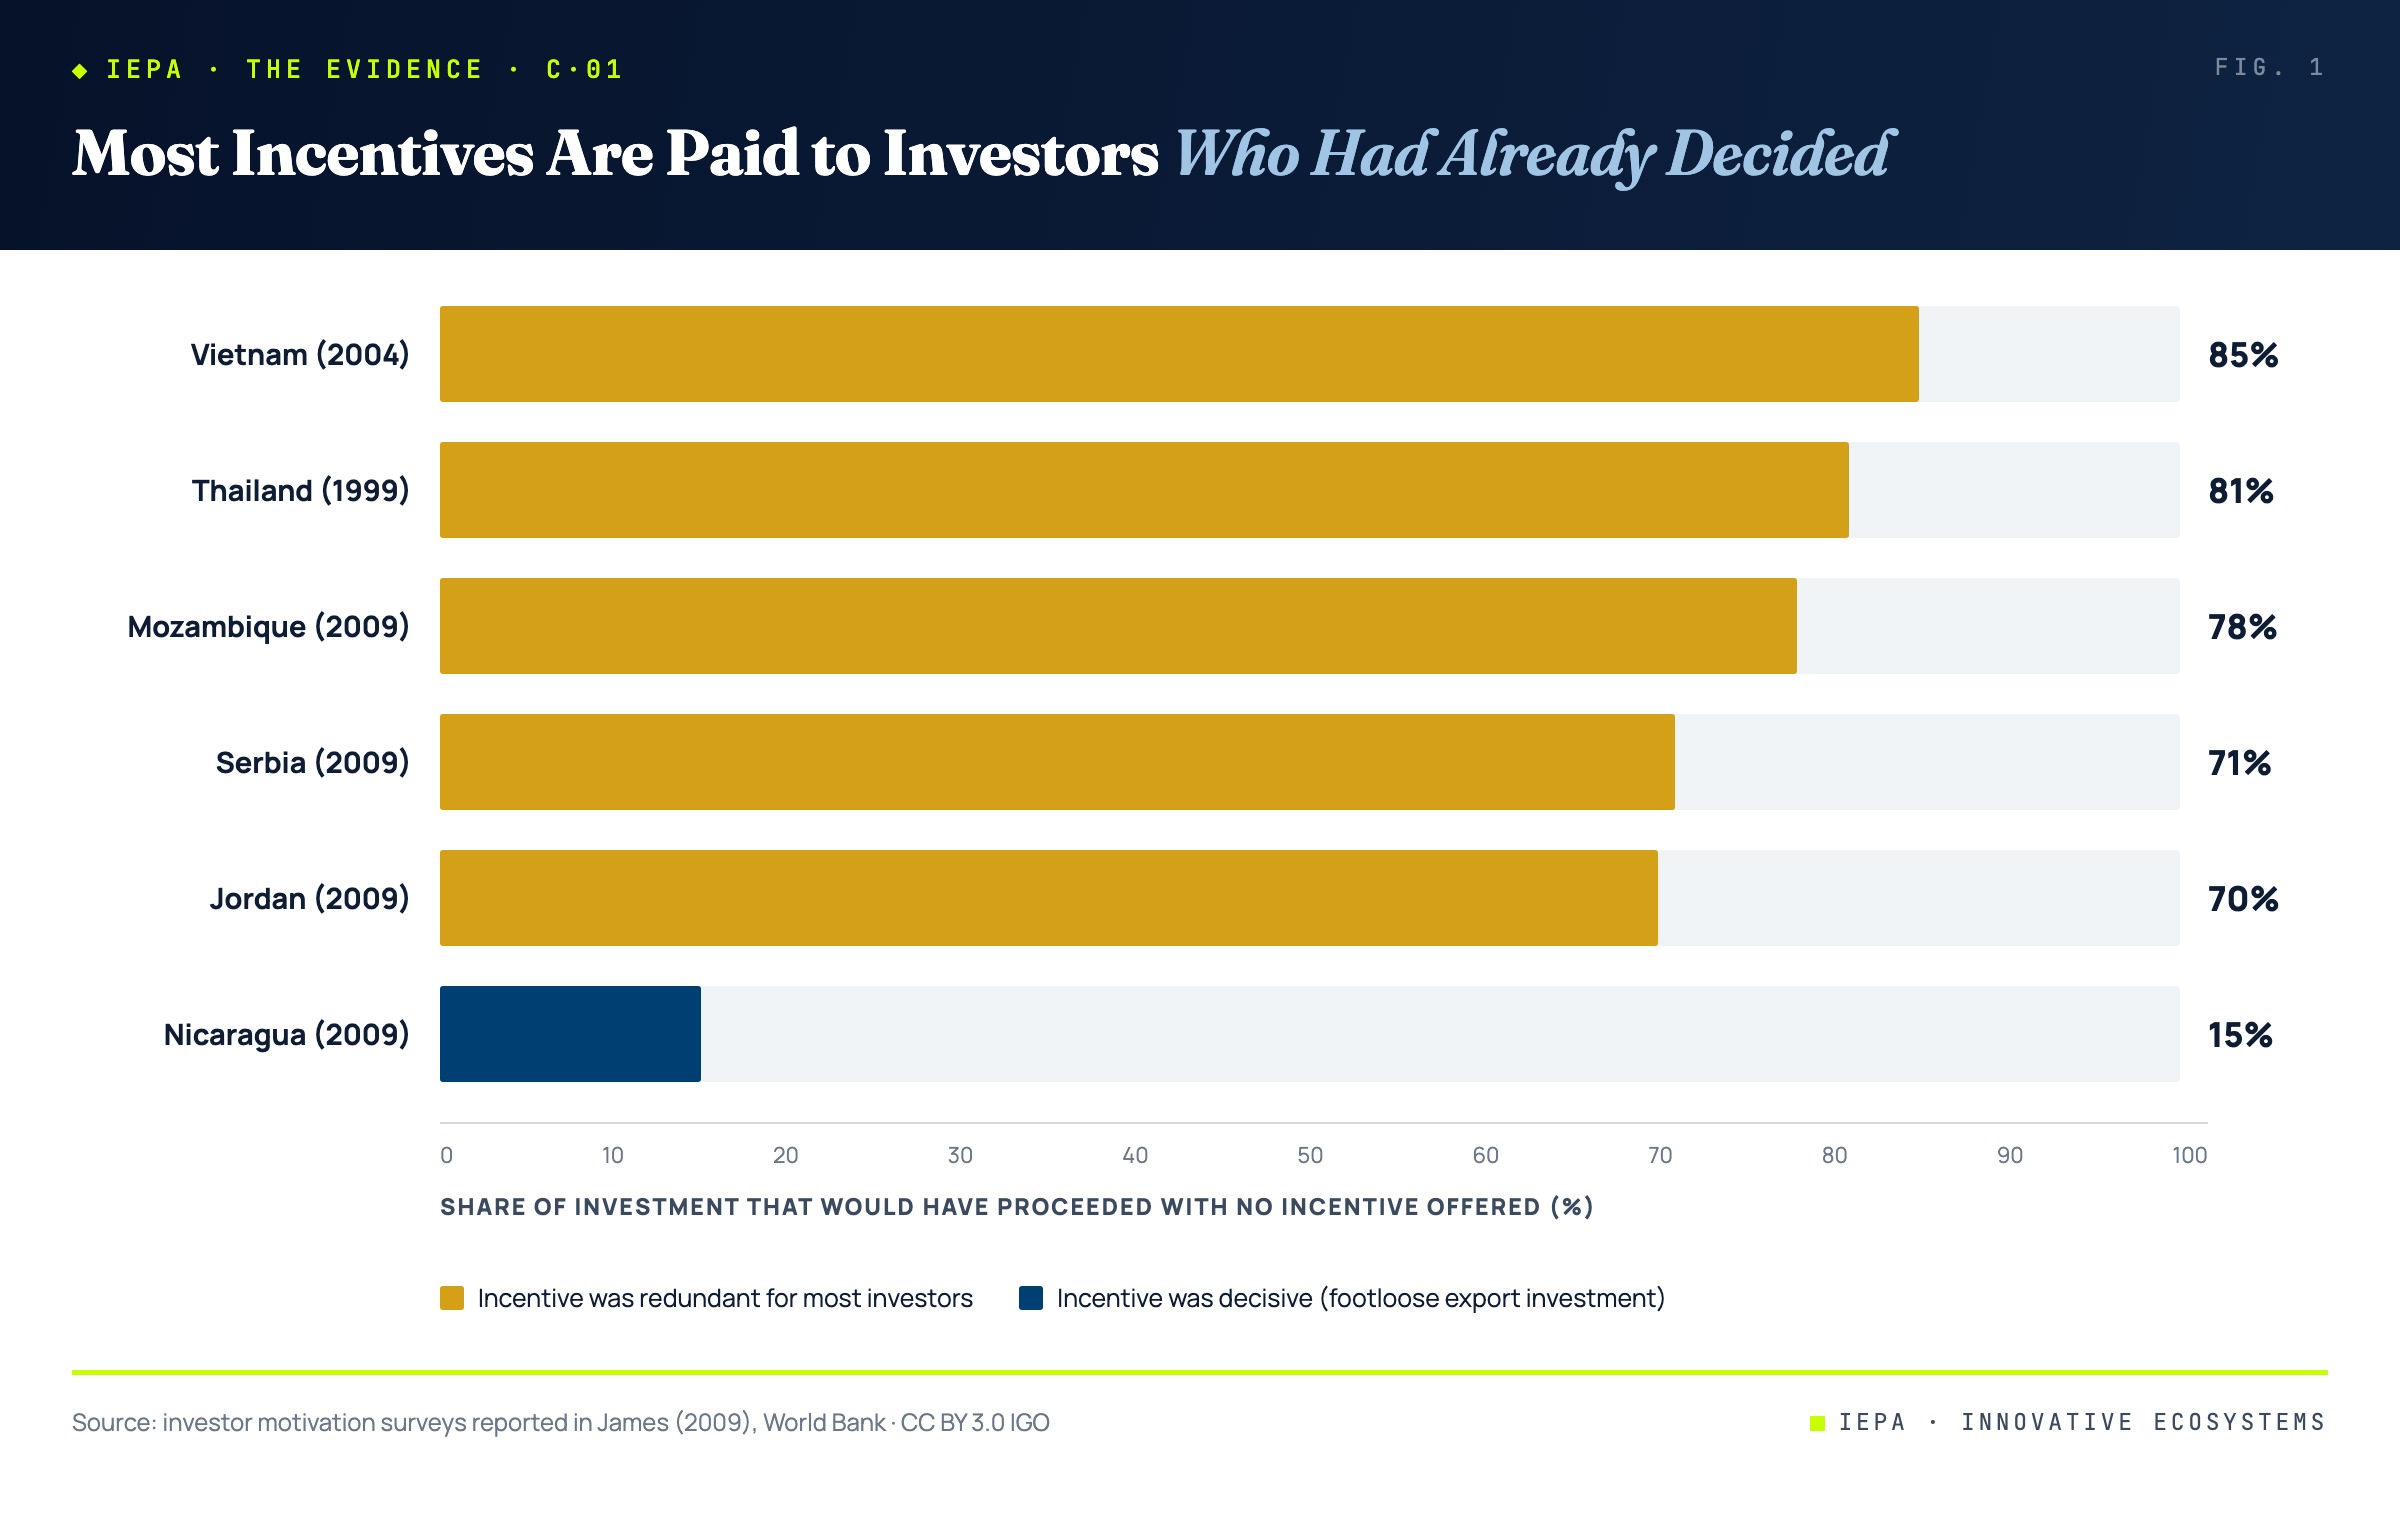
- Seventy percent or more would have come anyway. Investor surveys in Jordan, Mozambique and Serbia found redundancy ratios of 70, 78 and 71 percent. In Thailand the figure was 81 percent, in Vietnam 85. The incentive was paid to firms whose decision it did not change.
- They rarely change the size of the investment either. Asked whether incentives influenced how much they invested, 28 percent of investors in Jordan said yes. In Mozambique 13 percent. In Serbia 6.
- The cost is real and usually invisible. When Rwanda and Sierra Leone finally calculated the revenue they were forgoing, both found more than a third of revenues given up as incentives. Neither figure had appeared in a budget.
- Nicaragua is the exception, and it explains the rule. There, only 15 percent of investment was redundant, and Nicaragua also had the highest share of investors who had seriously considered another location. Incentives move footloose capital. They subsidize everything else.
- Forty years on, the analysis still is not being done. Lao PDR's 2024 review records that while incentives are aimed at attracting investment, there has been no cost-benefit analysis to evaluate value for money, and that firms do not rank tax incentives as the primary reason for choosing where to invest.
An investment incentive is a discount, and the entire question is who receives it. If it goes to a firm weighing your economy against three others, it may be the thing that tips the decision, and the revenue given up buys something real. If it goes to a firm that had already chosen you, it buys nothing at all: the investment arrives either way, and the discount is a transfer from the public to a company that did not need it. Distinguishing between the two is not a philosophical problem. It is a survey question, and it has been asked, repeatedly, across four decades and a range of economies. The answers are not ambiguous.
01The Question Behind Every Incentive
The method is older than most of the agencies using incentives today. In 1985 Guisinger and Associates devised what its authors called the extreme test: ask investors whether they would still have invested if everything else were identical and the incentive had simply not been offered. Firms that say no are the ones the incentive was for. Firms that say yes received a payment that changed nothing. The share of the second group is the redundancy ratio, and it is the only number that matters when judging whether an incentive regime is working.
The extreme test is a blunt instrument and it has the weaknesses of any self-reported measure. Investors have some interest in overstating how essential the incentive was, which if anything biases the ratio downward and makes the findings below conservative. What the method loses in precision it gains in directness. It asks the only question that separates an investment attracted from an investment subsidized.
02The Redundancy Ratio
Applied across economies, the test produces a consistent and uncomfortable picture. These are the ratios recorded in investor surveys, alongside the separate question of whether incentives influenced not just the decision to invest but the amount invested.
| Economy (survey year) | Would have invested anyway | Incentive changed the amount |
|---|---|---|
| Vietnam (2004) | 85% | not reported |
| Thailand (1999) | 81% | not reported |
| Mozambique (2009) | 78% | 13% |
| Serbia (2009) | 71% | 6% |
| Jordan (2009) | 70% | 28% |
| Nicaragua (2009) | 15% | 17% |
Read the first column and the scale of the transfer becomes clear. In four of these six economies, between seven and eight and a half investments in ten would have happened with no incentive at all. The revenue given up on those investments purchased nothing. It was not a failed attempt at persuasion; there was no persuasion to attempt, because the decision had already been made on other grounds.
The second column is the finding that gets less attention and deserves more. Even among firms that did receive incentives, very few report that the incentive changed how much they invested. Six percent in Serbia. Thirteen in Mozambique. The instrument is not only failing to attract investment that would not otherwise come; it is largely failing to enlarge the investment that does.
03Nicaragua Explains the Rule
One economy in the table breaks the pattern completely, and it is the most useful row of the six. In Nicaragua the redundancy ratio was 15 percent, meaning incentives were decisive for the large majority of investors rather than a minority. That is close to the outcome every incentive regime imagines for itself.
The reason is visible in the same survey. Nicaragua also recorded the highest share of investors who had seriously considered locating somewhere else. Its inward investment was concentrated in export-oriented, genuinely mobile operations, the kind of firm choosing between several comparable locations on cost. For that firm, a tax difference is a real input into a real comparison, and the incentive does the work it is supposed to do. The wider evidence points the same way: redundancy is highest for investment oriented toward the domestic market and for natural-resource projects, mining and tourism among them, where the asset is in your territory and nowhere else.
That is the distinction the instrument requires and the one most regimes never make. An incentive is a tool for competing over footloose capital. Offered to a firm that came for your market, your minerals or your coastline, it is a discount on something that was never for sale elsewhere. The question an agency should be able to answer before it writes an incentive is not whether the sector is a priority. It is whether the investor had a genuine alternative.
An incentive is a discount offered to a buyer with somewhere else to go. Offered to a buyer with nowhere else to go, it is simply a lower price.
04The Cost That Never Appears
A direct subsidy has to be appropriated, defended and renewed. Revenue forgone through the tax code has to be none of those things. It is money the state never collects, and money never collected does not show up as spending. The result is an instrument whose benefits are announced at a ribbon-cutting and whose costs are, in the ordinary course of events, never calculated at all.
When the calculation is performed, the numbers tend to arrest attention. Rwanda and Sierra Leone each prepared tax expenditure statements and each discovered that more than a third of tax revenues were being given up as incentives. Both governments, in the dry phrasing of the source, took notice. The point is not that either country was uniquely careless. It is that the figure was unknown until somebody produced it, in economies where a third of public revenue is not a rounding error.
The arithmetic that follows is unforgiving. If the redundancy ratios above are anywhere near right, the revenue gained from investment that genuinely responds to an incentive is likely to be outweighed by the revenue lost on investment that would have arrived regardless. The regime does not merely underperform. On the evidence, it can run at a net fiscal loss while being reported as a success, because the investments it did not cause are counted among its results.
05Why They Persist
If the evidence has been available since the 1980s, the interesting question is not whether incentives work but why they survive contact with it. The source is unusually candid on this, and the explanation is political rather than economic. Tax expenditures hold appeal precisely because their costs are unknown, because scrutiny from legislatures and other veto players is limited or absent, and because the revenue loss is dispersed over many years while the political benefit is immediate and photographable.
There is a plainer version of the same point, and the source states it directly: providing incentives is much easier for government officials than providing a secure and stable political environment, implementing economic reforms, or developing a skilled workforce. Those are the things that actually move investment decisions, and every one of them takes years and produces no announcement. An incentive can be legislated in a session. The comparison is not close, and the incentive wins on grounds that have nothing to do with whether it works.
Discretionary regimes compound the problem. Where incentives are awarded case by case rather than by published criteria, two comparable firms in the same sector can receive entirely different packages. That is an invitation to rent-seeking and it corrodes precisely the thing an investment climate depends on, which is an investor's confidence that the rules are the rules. The extreme case in the record is Russia in the 1990s, where fragmented power let politically connected elites secure exemptions estimated at more than two-thirds of federal taxes collected.
06Forty Years of Knowing
The most useful thing about this evidence is not any single number in it. It is how long the numbers have been available. The instrument for detecting redundancy dates to 1985. The surveys applying it ran through the late 1990s and 2000s. The synthesis pulling them together was published in 2009. And the finding has not been quietly superseded since: it has been restated, in the institution's own country work, in the years that followed.
| When | What the record shows |
|---|---|
| 1985 | The extreme test is devised: ask investors whether they would have invested with no incentive offered |
| 1999–2004 | Applied in Thailand (81% redundant) and Vietnam (85%) |
| 2009 | Synthesis across Jordan, Mozambique, Serbia and Nicaragua; redundancy of 70 to 78 percent in three of the four |
| 2020 | Serbia, measured at 71 percent in 2009, is advised that schemes attracting resource-seeking and market-seeking investors are often redundant and should be considered for rationalization |
| 2024 | Lao PDR: no cost-benefit analysis has been performed to evaluate value for money; redundancy noted because an investor anticipating high profits would likely have proceeded in any case |
Read down that column and the gap is the story. By 2009 the answer was in the open, with a method a decade older than that. Fifteen years later, a national review of Lao PDR records that the incentives exist, that no cost-benefit analysis has ever been done to evaluate value for money, and that surveys and empirical research find firms do not rank tax incentives as the primary reason for choosing where to invest. Political stability, macroeconomic stability and the legal framework come first.
The method is forty years old. The measurement is fifteen. The analysis, in the country that most recently looked, had still never been done.
That distance between knowing and doing is the thing worth taking from this piece, and it is not a story about incompetence. Every incentive regime described here was administered by people who could have read the same evidence. What the record shows is that the evidence was never the binding constraint. The instrument survives because it is fast to legislate, invisible in the budget, and immediately announceable, and no quantity of redundancy ratios changes any of those three facts. Anyone proposing to fix this with better evidence has misread which part is broken.
07The Builder's Reading
None of this argues for abolishing incentives, and the Nicaragua row is the reason. Where investment is genuinely mobile and the competition is genuinely close, a well-targeted incentive buys something. The argument is against deploying, as a general instrument, a tool that only works in a narrow case, without ever testing whether the case applies.
- Ask the counterfactual question before offering, not after. Would this investor have come anyway? If the agency cannot answer, it is not in a position to price the discount.
- Publish the revenue forgone. Budget it, project it, put it beside direct expenditure. An instrument whose cost is unknown will not be disciplined by anything else.
- Reserve incentives for footloose investment. Domestic-market and resource-bound projects show the highest redundancy. The asset is already here.
- Publish the criteria and remove discretion. Case-by-case awards produce unequal treatment among comparable firms, which is a governance risk before it is a fiscal one.
- Tie the benefit to performance, not to entry. Incentives linked to realized investment or employment are auditable. Tax holidays granted at the door are not.
The deeper reading is about what an incentive regime substitutes for. An agency that competes on discounts is competing on the one dimension where any rival can match it instantly and where the winner is whoever is most willing to forgo revenue. An agency that competes on the security of the operating environment, the depth of the workforce and the reliability of the rules is competing on things that take a decade to build and cannot be undercut in a legislative session. The evidence says the second kind of competition is the one that actually moves capital. It is simply the harder one to announce.
Redundancy ratios are drawn from investor motivation surveys conducted for the economies and years shown, using the counterfactual method introduced by Guisinger and Associates. Self-reported measures of this kind carry a known bias toward overstating an incentive's importance, which makes the reported redundancy conservative. The Nicaragua figure of 15 percent rises to 51 percent when restricted to non-exporting firms outside free zones. Figures are reproduced as recorded in the source and are not IEPA engine outputs.
- James, S. (2009). Incentives and Investments. World Bank, Investment Climate Advisory Services. CC BY 3.0 IGO.
- World Bank (2024). Lao PDR 2023: Forging Ahead. CC BY 3.0 IGO.
- Frias, J., Shimbov, B., Davies, E. and Ek, C. (2020). Serbia's New Growth Agenda. World Bank. CC BY 3.0 IGO.
- Guisinger, S. and Associates (1985). Investment incentives and performance requirements for export-oriented firms. Pre-digital work, cited in and verifiable through James (2009).
- Reuber, G. (1973). Private Foreign Investment in Development. Oxford University Press. Pre-digital monograph, catalogue record.
- Innovative EcoSystems. The Accelerator, Not the Engine. 2026.
- Innovative EcoSystems. The IEPA Index and Methodology. 2026.
Who Promotes the Promoters
Consultants posing as investors sent two project inquiries to 181 national promotion agencies. Twenty-nine scored above half marks.
→Explore the IEPA
Six zones, every market this research is scored from.
→Open the Atlas
The live global registry this research is drawn from.
→